Well known statistician Andrew Gelman and his colleagues write an informative and interesting weblog Statistical Modeling, Causal Inference, and Social Science on the quantitative side of the social sciences (which has a lot that ecologists or sustainability scientists can learn from). Below are some of the recent posts that I found informative and interesting:
At a statistical level, though, I think the details are very important, because they connect the data being graphed with the underlying questions being studied. For example, if you want to compare unemployment rates for different industries, you want them on the same scale. If you’re not interested in an alphabetical ordering, you don't want to put it on a graph. If you want to convey something beyond simply that big cars get worse gas mileage, you’ll want to invert the axes on your parallel coordinate plot. And so forth. When I make a graph, I typically need to go back and forth between the form of the plot, its details, and the questions I’m studying.
I used to think that fiction is about making up stories, but in recent years I’ve decided that fiction is really more of a method of telling true stories. One thing fiction allows you to do is explore what-if scenarios. I recently read two books that made me think about this: The Counterlife by Philip Roth and Things We Didn’t See Coming by Steven Amsterdam. Both books are explicitly about contingencies and possibilities: Roth’s tells a sequence of related but contradictory stories involving his Philip Roth-like (of course) protagonist, and Amsterdam’s is based on an alternative present/future. (I picture Amsterdam’s book as being set in Australia, but maybe I’m just imagining this based on my knowledge that the book was written and published in that country.) I found both books fascinating, partly because of the characters’ voices but especially because they both seemed to exemplify George Box’s dictum that to understand a system you have to perturb it.
In early January of 2010 a huge landscape destroyed the village of Attabad and dammed the Hunza river in Northwest Pakistan. The landslide dam resulted in the rapid growth of a new lake that has flooded a key road and many villages. NASA’s Earth Observatory website has images (and an early image) showing the flooding.
From NASA EOS acquired June 1, 2010. False colour - Red shows vegetation.
The lake as now overtopped the landslide dam, its the overflows erosion of this dam is threatening thousands of peope who live downriver. The Boston Globe has collected an fantastic set of photos of this disaster on its The Big Picture.
Women, who lived near a lake created after a landslide in Hunza district, cut barley in a field in Seeshghat village in Hunza district of northern Pakistan May 24, 2010. (REUTERS/Abrar Tanoli)
David Petley a Geography professor at Durham university in the UK runs a weblog monitoring the conditions at the dam.
Eminent coral reef ecologist Jeremy Jackson recently gave a talk at TED called How we wrecked the ocean, which presents a popular version of his research on the long-term human impact on the ocean.
A network approach to understand co-management, governance and complex social-ecological systems is becoming part of the toolbox used by researchers in our field, now recently in an article by Marín and Berkes (see below). A bunch of us is trying to form a community of researchers to exchange ideas on how to use network analysis in social-ecological studies and to join our NASEBERRY group, you can mail me (Henrik Ernstson, henrik(at)ecology.su.se).
Andrés Marín and Fikret Berkes uses a 2-mode social network approach in their recent article entitled “Network approach for understanding small-scale fisheries governance“. They make the argument that many studies up until now have focussed on collaborative ties, which might miss how conflicts could drive the structuration of social networks:
[S]tudying only collaborative (or facilitating) relationships may show an incomplete representation of co-management. In the Chilean case, co-management appeared as a dynamic equilibrium between opposing forces: facilitation or collaboration and hindrance or conflict. The existence of conflict and power disputes should not be seen as blocking the functioning of the system but as a driver of change and adaptation [1]
NASEBERRY – A community would be great to have
Within the field of social-ecological network studies, several other studies are on their way in both marine, terrestrial and urban ecosystems. Further, at the upcoming international conference on social network analysis (SUNBELT) there is a special session on network analysis and natural resource management (June 2010), and several of us are participating in a book project led by Örjan Bodin and Christina Prell to further develop this field.
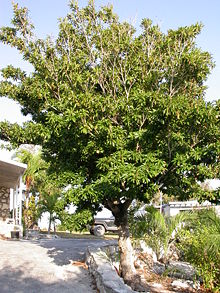
It is clear that several reserach groups are forming at various universities in the world, and at all continents. We hope our NASEBERRY group could be a good forum for many others to exchange exciting ideas. The name originates from “Network Analysis in Social-Ecological Studies” but has further borrowed its name from a long-lived evergreen tree growing in the Caribbean. The group include scholars that strive to advance both social, ecological and social-ecological network analysis in social-ecological studies. If you would like to join, please contact me Henrik Ernstson (henrik(at)ecology.su.se).
Stay cool. Stay networked. Stay in the (naseberry)tree!
/Henrik
PS. Marín A, Berkes F. (2010; in press) Network approach for understanding small-scale fisheries governance: The case of the Chilean coastal co-management. Marine Policy. doi:10.1016/j.marpol.2010.01.007
[1] With reference to: Armitage et al 2007: Adaptive co-management. Univ Brit Col Press.
Excerpt from CHICAGO BOUNDARIES Bill Rankin, 2009 (click on image to see full high resolution version)
He writes:
Nearly every U.S. city is radically (and disturbingly) segregated, with stark divides of race, ethnicity, and class. I’ve been playing with various ways to show these divisions, using graphics which are equally evocative, provocative, and rigorous. I’ve posted two new projects, showing two possibilities: one for Chicago, and another for New York.
In both projects I’m reacting in part against maps which show ethnic areas using solid homogeneous colors, often highlighting only the majority group — such as this Wikipedia map of Bosnia and Herzegovina, or this New York Times map of Pashtuns in the Sulaiman Mountains. Not only do these maps fail to show local diversity or ethnic overlaps, but they visually reinforce the all-or-nothing logic of national territorial statehood that made the conflicts in question so intractable in the first place. These cases are crying out for new forms of mapping — mapping which could directly provoke new ways of thinking. (In other words, radical cartography to the rescue!)
Nature reports on how Marine Reserves can be a ‘win–win’ for fish and fishermen. Our colleague Terry Hughes research is mentioned.
Nature Reports Climate Change has several articles that relate to resilience to sea level rise. Mark Schrope describes coastal development in Florida (which combines a lack of planning with a lack of memory). Mason Inman reports on ecological engineering to adapt to sea level rise.
On his group’s weblog, influential Bayesian statistican Andrew Gelman proposes a statistical lexicon to make important methods and concepts related to statistics better know:
The Secret Weapon: Fitting a statistical model repeatedly on several different datasets and then displaying all these estimates together.
The Superplot: Line plot of estimates in an interaction, with circles showing group sizes and a line showing the regression of the aggregate averages.
The Folk Theorem: When you have computational problems, often there’s a problem with your model. …
Alabama First: Howard Wainer’s term for the common error of plotting in alphabetical order rather than based on some more informative variable.
The Blessing of Dimensionality: It’s good to have more data, even if you label this additional information as “dimensions” rather than “data points.”
Scaffolding: Understanding your model by comparing it to related models.
Multiple Comparisons: Generally not an issue if you’re doing things right but can be a big problem if you sloppily model hierarchical structures non-hierarchically.Taking a model too seriously: Really just another way of not taking it seriously at all.
Google and renewable energy? Hackers, deforestation and carbon emission rights? This might sound like an odd mix of events, but something is definitely in pipeline. Global environmental change and rapid information technological change have for a long time been viewed as parallel, and decoupled global phenomena. A number of events in the last month indicate that this is likely to change. Just consider the following events:
Internet giant Google recently got an approval in the US, to buy and sell energy. This happens after the company’s explicit ambition to become one of the major players in renewable energy. According to the New York Times: “The company’s Green Energy Czar Bill Weihl said the company was fully committed to accelerating the development of renewable energy technologies that can prove more cost-effective than coal power, as a means of both curbing carbon emissions and trimming its own giant energy bill”.
In addition, computer hackers seem to have found a new pool of resources to steal from – emissions trading. As reported by Wired recently, hackers have been successful in stealing millions of dollars by launching “a targeted phishing attack against employees of numerous companies in Europe, New Zealand and Japan, which appeared to come from the German Emissions Trading Authority”. A similar attack was assumed in Brazil in December 2008 when hackers managed to get in to the government logging databases. The impacts? Illegal harvest of 1.7 million cubic meters of timber, according to Wired.
One final example is of course the ongoing bashing of the IPCC, and the now infamous e-mail hack of UK climate scientists. An interesting follow up is this op-ed in The Australian, arguing that the Internet is allowing climate change skeptics to gain traction. One of the more thought-provoking quotes from the article states:
The `climate consensus’ may hold the establishment — the universities, the media, big business, government — but it is losing the jungles of the web. After all, getting research grants, doing pieces to camera and advising boards takes time. The very ostracism the sceptics suffered has left them free to do their digging untroubled by grant applications and invitations to Stockholm.
Tiffany Vance and Ronald Doel have traced the history of the Stommel diagram from physical oceanography into biology, in their 2010 paper Graphical Methods and Cold War Scientific Practice: The Stommel Diagram’s Intriguing Journey from the Physical to the Biological Environmental Sciences in Historical Studies in the Natural Sciences (DOI: 10.1525/hsns.2010.40.1.1.)
The paper provides an rich history of how the innovative oceanographer Henry Stommel created his diagrams to emphasize the cross-scale dynamics of the ocean (See figure below), and how his diagram was adapted by biological oceanographers. However, they miss how Stommel diagrrams moved into ecosystem ecology and sustainability science.
Below I present a series of Stommel diagrams. The first three figures are reproduced in Vance and Doel’s paper, the later three are from sustainability science.
First, Stommel’s original figure, which was designed to show how oceanic processes varied across scales, and that sampling efforts had to be planned with a consideration of these.
Schematic diagram of the spectral distribution of sea level (From Stommel 1963. Varieties of Oceanographic Experience. Science)