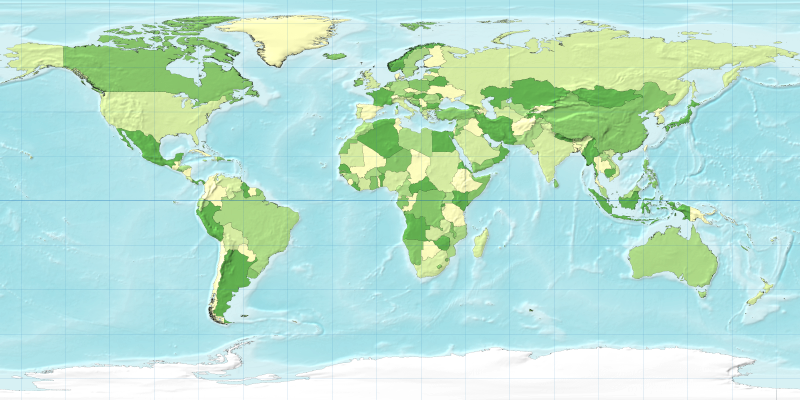
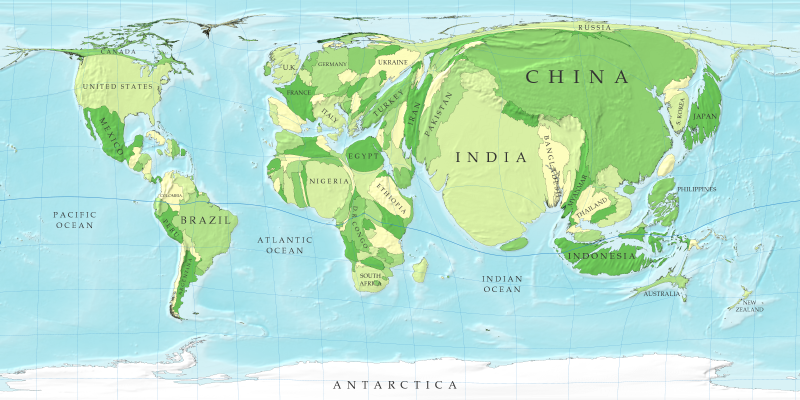
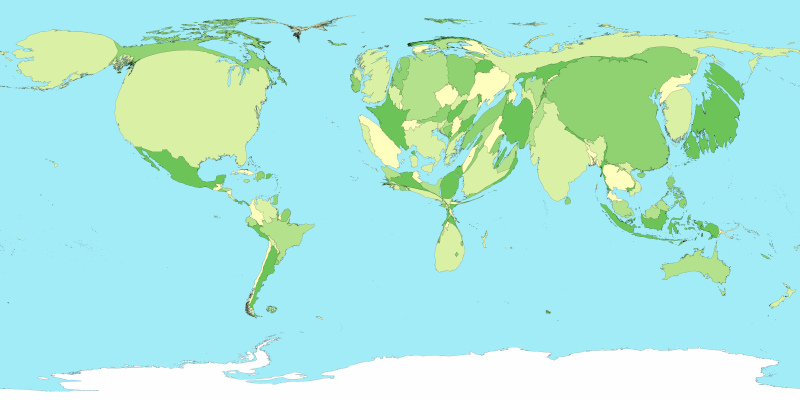
Mark Newman (see previous post Another world population map) has used his cartogram technique to make a series of sharp cartograms of the world (smoother than these rougher cartograms), some of which are shown below (land area, population, GDP, and GHG emissions):

This approach was used to create the simpler Worldmapper Project collection of cartograms. A series of their population cartograms are showed below.
Information and code for the cartogram algorithm are available on Michael Gastner’s website.
See also this earlier post on visualizing ecological footprints.


 Map by land area
 1900
1900 1960
1960 2000
2000 2050 (UN med. projection)
Thanks for making these cartograms available!